Skip Navigation

weather.gov

NOAA - Click to go to the NOAA homepage National Weather Service Advanced Hydrologic Prediction Service NWS logo - Click to go to the NWS homepage
Navbar left image Home News Organization
Navbar End cap

Blackwater River (VA) near FRANKLIN, VA (FKLV2)


Data Type


Inundation Levels
NAVD88 Stage

25.025.0
24.024.0
23.023.0
22.022.0
21.021.0
20.020.0
19.019.0
18.018.0
17.017.0

Major Flooding Begins

16.016.0
15.015.0
14.014.0
13.013.0
12.012.0
11.011.0
Record Crest: 10.78 ft
10.710.7

Moderate Flooding Begins

10.010.0
9.09.0
8.08.0
7.07.0
6.06.0

Minor Flooding Begins

5.05.0
4.04.0

Near Flooding Begins


Below Flooding Begins

* = Extended rating
Weather Forecast Office Wakefield, VA Southeast River Forecast Center
Hydrograph River at a Glance Download Inundation
Mapping
Loading...

Click on mapped inundation to see water depth values for that location, or hold shift and drag to zoom to area.

Current Stage:
1.0 ft at 04/30/2024 06:15:00 UTC
Selected Inundation
Mouse Location

North Arrow

Inundation Legend
Depth in feet
USGS Gauge Location Gauge Location
What is UTC time? Map Help

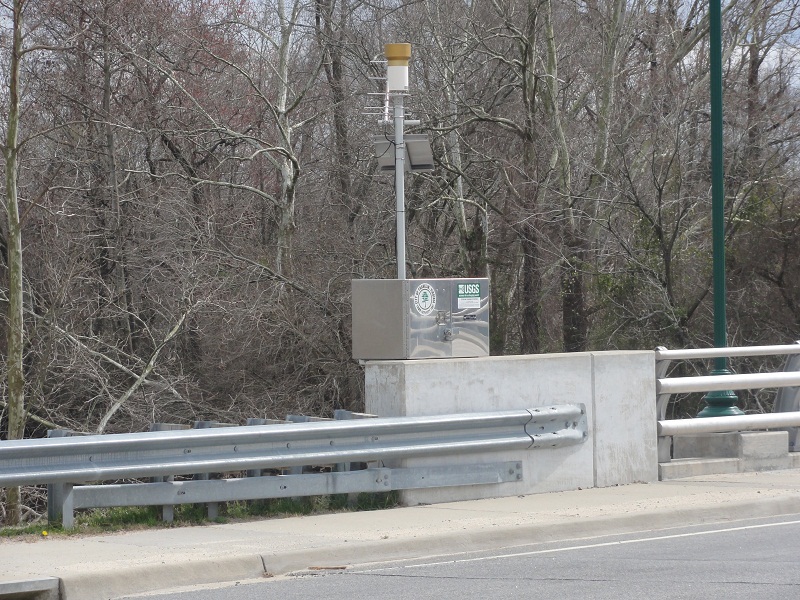
Latitude/Longitude Disclaimer: The gauge location shown in the above map is the approximate location based on the latitude/longitude coordinates provided to the NWS by the gauge owner.

Gauge Information Collapse

Map Overlays

Flood Categories (in feet)
Major Flood Stage: 16
Moderate Flood Stage: 10
Flood Stage: 5
Action Stage: 3
Low Stage (in feet): -9999

Historic Crests
(1) 10.78 ft on 10/10/2016
(2) 8.89 ft on 09/21/2020
(3) 8.05 ft on 11/14/2020
(4) 7.53 ft on 02/20/2021
(5) 6.39 ft on 06/13/2013
Show More Historic Crests

(P): Preliminary values subject to further review.

Recent Crests
(1) 5.50 ft on 03/10/2024 (P)
(2) 7.53 ft on 02/20/2021
(3) 8.05 ft on 11/14/2020
(4) 8.89 ft on 09/21/2020
(5) 6.37 ft on 08/19/2020
Show More Recent Crests

(P): Preliminary values subject to further review.

Low Water Records
Currently none available.

Graphical representation of flood inundation for NWS flood categories are based on steady state hydraulic modeling of water surface elevations for incremented discharges. Map shows approximate inundation areas for given water surface elevations and should not be used for navigation or permitting or other legal purposes, but strictly as a planning reference tool.

Flood Impacts Collapse
If you notice any errors in the below information, please contact our Webmaster
20 River stage sensor operating limit
16 Businesses along Main Street and South Street begin to flood.
13 Gazebo near the Riverwalk is now flooded.
8 Water overflows rip rap on right downstream side of bridge across US 58/258 in vicinity of the gage. Lowlands upstream of bridge now inundated. Roadway entrance to water treatment plant and public boat ramp begin to flood.
4.5 Water covers the docks/pier near the Gazebo.
3.5 Water covers boat ramp docks at public boat ramp.
3 Water begins to flow over retaining wall on left downstream side of bridge in vicinity of the gage.
Photos
(1) Tidal Gage House in the City of Franklin on the Blackwater River
Other Data Sources Collapse
Additional Information Collapse

Gage Photos

Gage Photo

Hydromet Outlook
48 Hour Hydrometerological Outlook Link to Graphic
Significant Flood Outlook
Significant River Flood Outlook Link to Graphic
Flash Flood Guidance
Flash Flood Guidance Link to Graphic

Additional Water and Weather Topics from the Southeast River Forecast Center (SERFC):
SERFC Home Page, Current Hazards, Water Information, Water Resources,
Weather Information
, Radar and Satellite, Tropical Weather, Climate,
Text Products, Additional Links,About the SERFC,
Contact Us


Resources Collapse
Hydrologic Resources
Additional Resources
Collaborative Agencies Collapse
The National Weather Service prepares its forecasts and other services in collaboration with agencies like the US Geological Survey, US Bureau of Reclamation, US Army Corps of Engineers, Natural Resource Conservation Service, National Park Service, ALERT Users Group, Bureau of Indian Affairs, and many state and local emergency managers across the country. For details, please click here.
NWS Information
National Weather Service
Ask Questions/Webmaster
Page last modified: 2-Nov-2020 7:34 PM
Disclaimer
Credits
Glossary
Privacy Policy
About Us
Career Opportunities
Graphical representation of flood inundation for NWS flood categories are based on steady state hydraulic modeling of water surface elevations for incremented discharges. Map shows approximate inundation areas for given water surface elevations and should not be used for navigation or permitting or other legal purposes, but strictly as a planning reference tool.