Latitude/Longitude Disclaimer: The gauge location shown in the above map is the approximate location based on the latitude/longitude coordinates provided to the NWS by the gauge owner.
Gauge Information
Map Overlays
FEMA's National Flood Hazard Layers not showing?
Why aren't the FEMA National Flood Hazard Layers showing on the ESRI Map?
Possible reasons:
There are no FEMA National Flood Hazard Layers for the location which you are viewing on ESRI Maps.
The FEMA Web Mapping Service (WMS) is down.
Note: Your zoom level may have changed. ESRI's zoom levels must be between 14 and 16 to show National Flood Hazard layers.
Note: Your zoom level may have changed. ESRI's zoom levels must be between 14 and 16 to show National Flood Hazard layers.
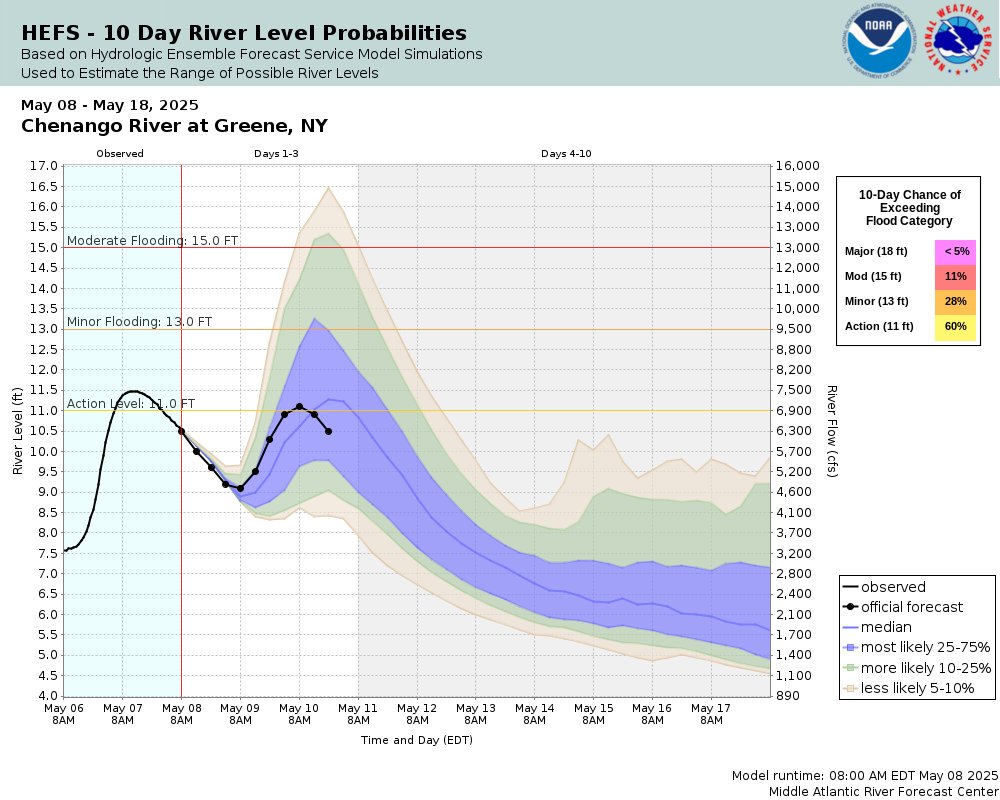
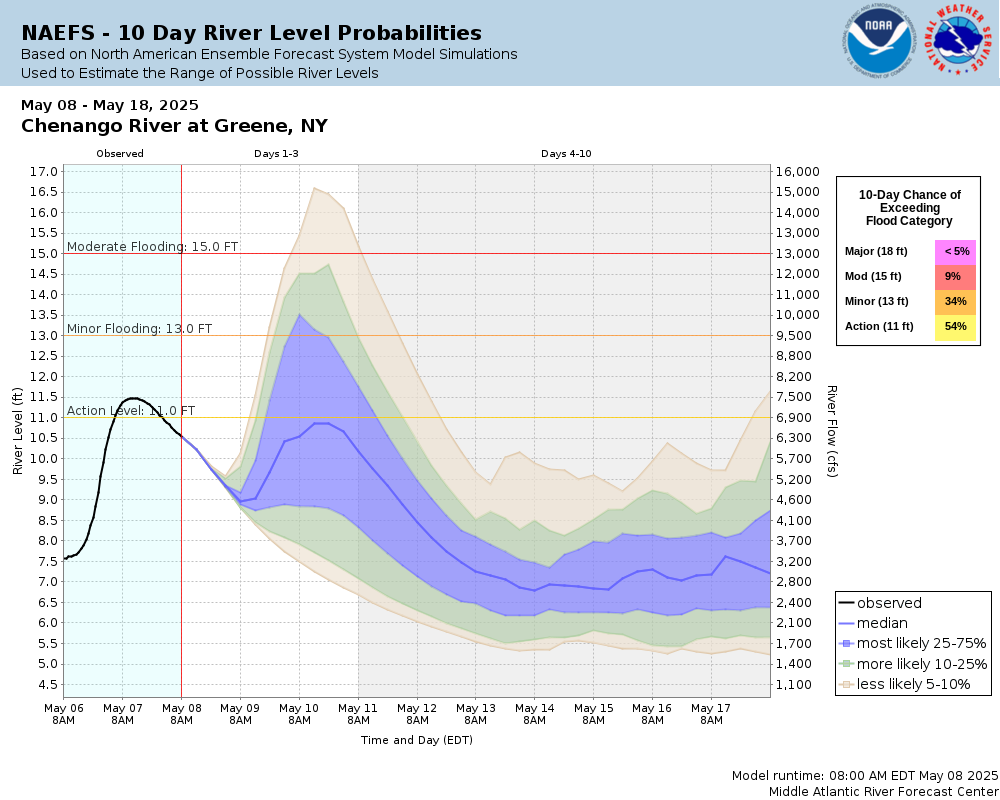
Flood Categories (in feet)
Major Flood Stage:
18
Moderate Flood Stage:
15
Flood Stage:
13
Action Stage:
11
Low Stage (in feet):
-9999
Historic Crests
(1) 22.00 ft on 07/08/1935
(2) 21.16 ft on 06/28/2006
(3) 21.09 ft on 09/08/2011
(4) 18.67 ft on 04/03/2005
(5) 18.33 ft on 12/31/1942 Show More Historic Crests
(P): Preliminary values subject to further review.
Recent Crests
(1) 13.26 ft on 12/19/2023 (P)
(2) 13.64 ft on 05/01/2023 (P)
(3) 14.71 ft on 12/26/2020
(4) 14.08 ft on 09/18/2018
(5) 13.62 ft on 01/24/2018 Show More Recent Crests
(P): Preliminary values subject to further review.
Low Water Records Currently none available.
Graphical representation of flood inundation for NWS flood categories are based on steady state hydraulic modeling of water surface elevations for incremented discharges. Map shows approximate inundation areas for given water surface elevations and should not be used for navigation or permitting or other legal purposes, but strictly as a planning reference tool.
Site-specific information: A report discussing the technical aspects of these maps can be found
here. These maps represent unobstructed flow conditions and may be
unrepresentative when ice jams and/or debris are in place.
Extended rating: Rating Curve Extension - The Rating Curve Extension is calculated by using either a linear, logarithmic, or hydraulic technique to extend the rating curve above the currently established relationship between stage and flow.
Flood Impacts
If you notice any errors in the below information, please contact our Webmaster
22
Maximum estimated flood of July 8, 1935. Stage estimated by an Army Corps of Engineers hydrologic study. Widespread inundation of the village occurred from Chenango Street to the river. In addition to extreme flooding of the village, flood waters would approach the east side of Route 12, north of the Village of Greene.
21.4
Height of the gage floor, and maximum stage that gauge can read.
21.16
Record flood crest as measured by the USGS stream gauge from June, 2006. Widespread flooding throughout the Village of Greene.
21.09
September, 2011 flood. Widespread inundation in many areas of the Village of Greene. Significant inundation of residences between N. Canal and N. Chenango Streets to the north of Scott Ave. Flood waters several feet deep around the village.
18
Major Flood Stage. Widespread flooding reaches first floor of homes on North Chenango, Water, Monell, Mill and Elm Streets in the Village of Greene. Backwater from Birdsall Creek can cause flooding between Elm Street, N. Canal Street and Scott Avenue. Flood waters close off Cherry Street.
15
Moderate flood stage, the ball flats in Greene are inundated, including Ball Flats Road. Water Street is closed with homes on the east side of the street beginning to flood. Flooding affects homes on Monell Street and Monell Street Extension. Water spreads into the backyards of homes along N. Chenango Street. Birdsall Creek may be backing up along N. Chenango and Elm Street.
14
Water Street and Stillwater Road in Greene are flooded.
13
Flood stage. River overflows onto low spots across Water Street near the gauge house, and spreads into the ball flats.
The National Weather Service prepares its forecasts and other services in collaboration with agencies like the US Geological Survey, US Bureau of Reclamation, US Army Corps of Engineers, Natural Resource Conservation Service, National Park Service, ALERT Users Group, Bureau of Indian Affairs, and many state and local emergency managers across the country. For details, please click here.
Graphical representation of flood inundation for NWS flood categories are based on steady state hydraulic modeling of water surface elevations for incremented discharges. Map shows approximate inundation areas for given water surface elevations and should not be used for navigation or permitting or other legal purposes, but strictly as a planning reference tool.