Latitude/Longitude Disclaimer: The gauge location shown in the above map is the approximate location based on the latitude/longitude coordinates provided to the NWS by the gauge owner.
Gauge Information
Map Overlays
FEMA's National Flood Hazard Layers not showing?
Why aren't the FEMA National Flood Hazard Layers showing on the ESRI Map?
Possible reasons:
There are no FEMA National Flood Hazard Layers for the location which you are viewing on ESRI Maps.
The FEMA Web Mapping Service (WMS) is down.
Note: Your zoom level may have changed. ESRI's zoom levels must be between 14 and 16 to show National Flood Hazard layers.
Note: Your zoom level may have changed. ESRI's zoom levels must be between 14 and 16 to show National Flood Hazard layers.
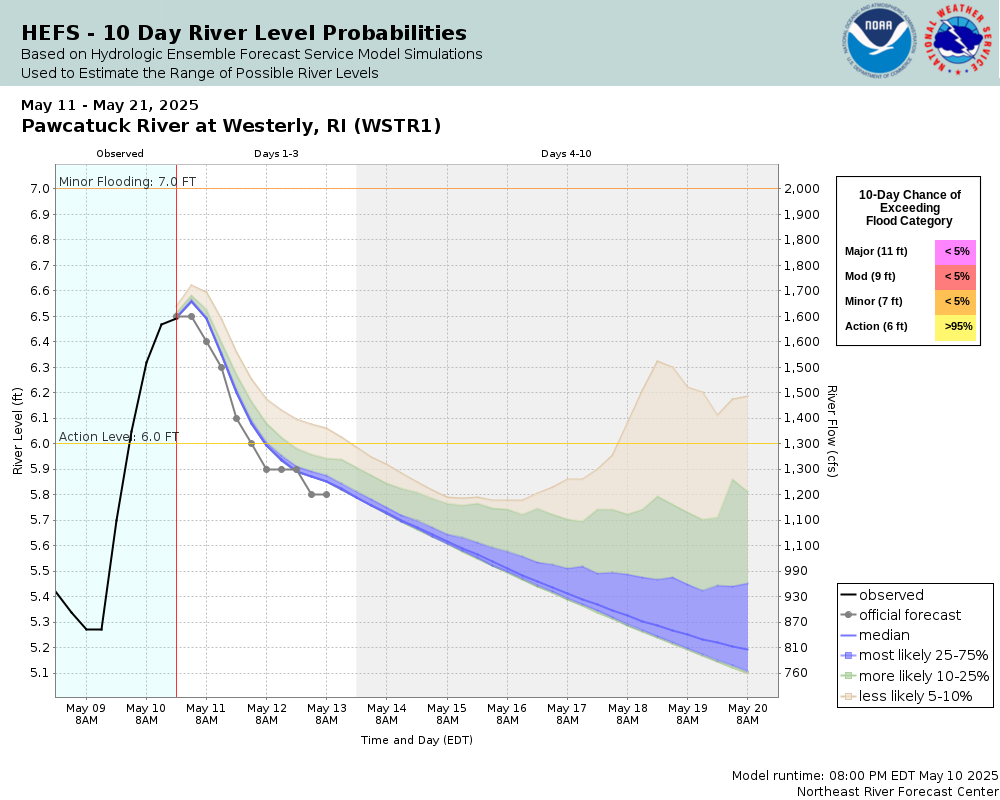
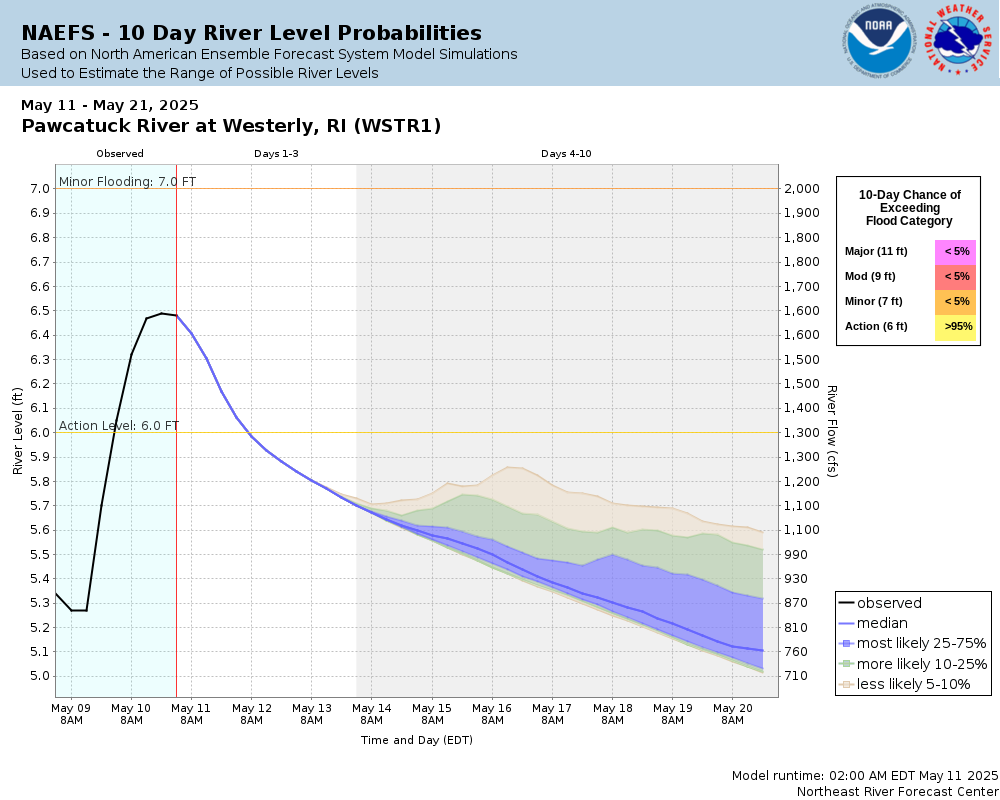
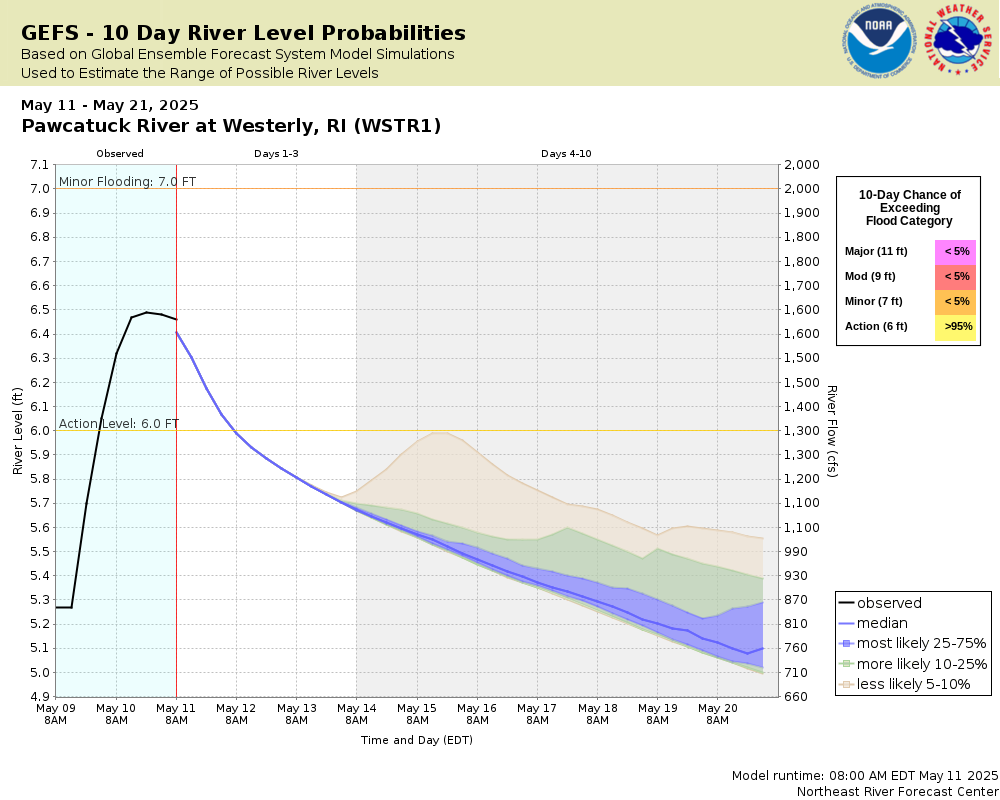
Flood Categories (in feet)
Major Flood Stage:
11
Moderate Flood Stage:
9
Flood Stage:
7
Action Stage:
6
Low Stage (in feet):
-9999
Historic Crests
(1) 15.00 ft on 09/21/1938
(2) 12.86 ft on 06/06/1982
(3) 10.49 ft on 03/18/1968
(4) 9.84 ft on 01/13/2024
(5) 9.78 ft on 04/25/1983 Show More Historic Crests
(P): Preliminary values subject to further review.
Recent Crests
(1) 7.47 ft on 03/30/2024
(2) 7.58 ft on 03/26/2024
(3) 9.13 ft on 03/11/2024
(4) 7.00 ft on 03/06/2024
(5) 7.34 ft on 03/03/2024 Show More Recent Crests
(P): Preliminary values subject to further review.
Low Water Records Currently none available.
Graphical representation of flood inundation for NWS flood categories are based on steady state hydraulic modeling of water surface elevations for incremented discharges. Map shows approximate inundation areas for given water surface elevations and should not be used for navigation or permitting or other legal purposes, but strictly as a planning reference tool.
Site-specific information: These maps were provided to the NWS courtesy of the USGS. The technical details for these maps can be found in this USGS Report.The maps were prepared in cooperation with the Town of Westerly, Rhode Island and the Rhode Island Office of Housing and Community Development. Map files were adapted by NWS to be viewable in AHPS.
Extended rating: The Rating Curve Extension is calculated by using either a linear, logarithmic, or hydraulic technique to extend the rating curve above the currently established relationship between stage and flow.
Flood Impacts
If you notice any errors in the below information, please contact our Webmaster
12
Major flooding occurs in Westerly, Hopkinton, Stonington and New Stonington. Areas hardest hit include the following, in Hopkinton, Maxson, Church and Laurel Streets, Route 3, and French Village. In Westerly, Hiscox Road, Saratoga Street and Canal Street. Substantial flooding occurs on Route 49 by the Stonington and North Stonington town line. Follow the advice of local officials, and evacuate if asked to do so.
11
Floodwaters inundate Route 3 near the Hopkinton and Westerly town line, with substantial flooding at French Village. Flooding forces closures of Maxson and Laurel Streets in Hopkinton. Hiscox Road and several homes in that neighborhood are inundated, floodwaters also reach onto lower Saratoga Street and low lying areas of Canal Street. Inundation also occurs along portions of Stonington and New Stonington including a portion of Route 49. Follow the advice of local officials, evacuate if asked to do so.
10
Floodwaters encroach on Route 3 near the Hopkinton and Westerly town line, with substantial flooding at French Village. Hiscox Road is closed due to flooding from Route 3 past Saratoga Street, and low lying homes are impacted in that neighborhood. Floodwaters encroach on low lying industrial and residential properties along Canal Street. Stonington and New Stonington are also impacted, including a portion of Route 49. Follow the advice of local officials, and evacuate if asked to do so.
9
Lowland flooding is anticipated from Hopkinton downriver through Westerly, Stonington and New Stonington. Lowest lying homes along Hiscox Road in Westerly are inundated by floodwaters. Along Route 3, flooding occurs at homes in French Village in Hopkinton. Follow the advice of local officials, and evacuate if asked to do so. Floodwaters may inundate Route 49 by the North Stonington and Stonington town line.
8
Floodwaters approach lowest lying homes along Hiscox Road in Westerly. Along Route 3, flooding occurs at some homes in French Village in Hopkinton.
7
Minor lowland flooding occurs along the Pawcatuck River. Along Route 3 in Hopkinton, floodwaters encroach on lowest lying homes in French Village.
The National Weather Service prepares its forecasts and other services in collaboration with agencies like the US Geological Survey, US Bureau of Reclamation, US Army Corps of Engineers, Natural Resource Conservation Service, National Park Service, ALERT Users Group, Bureau of Indian Affairs, and many state and local emergency managers across the country. For details, please click here.
Graphical representation of flood inundation for NWS flood categories are based on steady state hydraulic modeling of water surface elevations for incremented discharges. Map shows approximate inundation areas for given water surface elevations and should not be used for navigation or permitting or other legal purposes, but strictly as a planning reference tool.


